def plot_ax(figsize=(12 / 2.54, 9 / 2.54)):
"""
The function `plot_ax` creates a matplotlib figure and axis with specified figure size and tick
parameters.
Args:
figsize: The `figsize` parameter in the `plot_ax` function is used to specify the size of the
figure (plot) in inches. The default value is `(12 / 2.54, 9 / 2.54)`, which corresponds to a width
of 12 cm and a
Returns:
the `ax` object, which is an instance of the `Axes` class from the `matplotlib.pyplot` module.
"""
import matplotlib.pyplot as plt
width = 1.2
fig, ax = plt.subplots(constrained_layout=True, figsize=figsize)
ax.tick_params(width=width)
ax.spines['left'].set_linewidth(width)
ax.spines['right'].set_linewidth(width)
ax.spines['bottom'].set_linewidth(width)
ax.spines['top'].set_linewidth(width)
return ax
def calc_rdf_and_cn(traj,center_sel:str,ref_sel:str, r_range=[0,0.5],dr = 0.002, **kwargs):
"""
The function `calc_rdf_and_cn` calculates the radial distribution function (RDF) and coordination
number for a given trajectory, center selection, and reference selection.
Args:
traj: The `traj` parameter is a molecular dynamics trajectory, which is typically represented as a
`mdtraj.Trajectory` object. It contains the atomic positions and other information of a system over
time.
center_sel (str): The `center_sel` parameter is a string that specifies the selection of atoms
that will be used as the center for calculating the radial distribution function (RDF) and
coordination number. This selection can be based on atom indices, atom names, residue names, or any
other valid selection syntax supported by the
ref_sel (str): The `ref_sel` parameter is a string that specifies the selection of atoms in the
reference group. It is used to calculate the radial distribution function (RDF) and coordination
number with respect to this group.
r_range: The `r_range` parameter specifies the range of distances over which the radial
distribution function (RDF) will be calculated. It is a list containing two values: the minimum
distance and the maximum distance. The RDF will be calculated for distances within this range.
dr: The `dr` parameter is the width of each bin in the radial distribution function (RDF)
calculation. It determines the resolution of the RDF plot. Smaller values of `dr` will result in a
higher resolution RDF plot, but will also increase the computational cost of the calculation.
Returns:
two arrays: rdf and coordination_number.
"""
import mdtraj as md
import numpy as np
center = traj.topology.select(center_sel)
ref = traj.topology.select(ref_sel)
pairs = traj.topology.select_pairs(center,ref)
rdf = md.compute_rdf(traj, pairs, r_range=r_range, bin_width=dr, **kwargs)
rho = len(ref)/traj.unitcell_volumes[0]
coordination_number = []
for r, g_r in zip(rdf[0], rdf[1]):
coordination_number.append(4*np.pi*r*r*rho*g_r*dr + coordination_number[-1] if coordination_number else 0)
rdf = np.array(rdf)
coordination_number = np.array(coordination_number)
return rdf, coordination_number
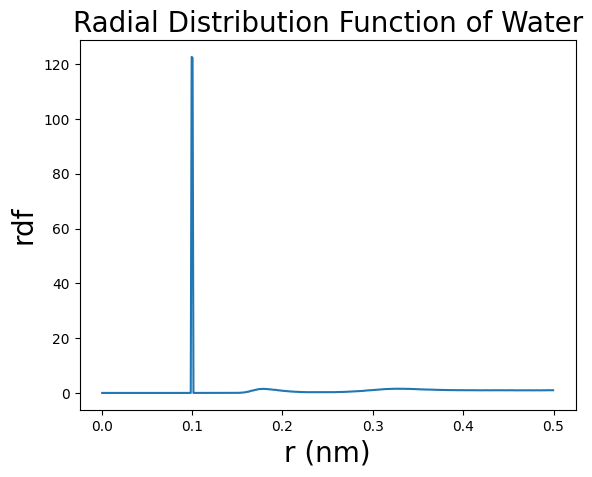
def draw_rdf_cn(ax1,rdf,coordination_number):
"""
The function `draw_rdf_cn` takes in an axes object `ax1`, radial distribution function data `rdf`,
and coordination number data `coordination_number`, and plots the RDF and coordination number on
separate y-axes with a shared x-axis.
Args:
ax1: The ax1 parameter is the first subplot axis object where the RDF (Radial Distribution
Function) and its corresponding Y-axis will be plotted.
rdf: The rdf parameter is a list containing two lists: the first list contains the x-values (r
values) and the second list contains the y-values (rdf values).
coordination_number: The coordination_number parameter is a list or array containing the values of
the coordination number for each value of r in the RDF.
Returns:
two axes objects, `ax1` and `ax2`.
"""
x = rdf[0]
y1 = rdf[1]
y2 = coordination_number
# 绘制第一个Y轴的数据
ax1.plot(x, y1, color='#3370ff', label='RDF')
ax1.set_xlabel('r (nm)',fontsize=18)
ax1.set_ylabel('RDF', color='#3370ff',fontsize=18)
ax1.set_xlim(min(x),max(x))
ax1.set_ylim(0,)
# 创建第二个Y轴,共享X轴
ax2 = ax1.twinx()
ax2.set_ylim(0,max(y2)*1.1)
# 绘制第二个Y轴的数据
ax2.plot(x, y2, color='#133c9a', label='CN')
ax2.set_ylabel('Coordination Number', color='#133c9a',fontsize=18)
# 添加图例
lines1, labels1 = ax1.get_legend_handles_labels()
lines2, labels2 = ax2.get_legend_handles_labels()
lines = lines1 + lines2
labels = labels1 + labels2
ax1.legend(lines, labels, frameon=False,fontsize=18,loc='upper left')
return ax1,ax2
def find_rdf_peaks(ax2,rdf,cn, **kwargs):
"""
The function `find_rdf_peaks` takes in an axis object, radial distribution function (rdf), and
coordination number (cn), and plots the peaks of the rdf on the axis object.
Args:
ax2: ax2 is a matplotlib Axes object, which represents a subplot in a figure. It is used to plot
the RDF peaks and annotate them with text.
rdf: The `rdf` parameter is a tuple containing two arrays. The first array `rdf[0]` represents the
x-values (e.g., distance) and the second array `rdf[1]` represents the y-values (e.g., radial
distribution function).
cn: The parameter "cn" represents the values of the coordination number (or any other quantity)
corresponding to each point in the radial distribution function (rdf). It is used to plot the peaks
found in the rdf.
Returns:
the modified `ax2` object.
"""
from scipy.signal import find_peaks
from scipy.signal import savgol_filter
rdf_smooth = savgol_filter(rdf[1], 10, 1)
peaks,props = find_peaks(-rdf_smooth,prominence=max(rdf[1])*0.02,**kwargs)
for peak in peaks:
x = rdf[0][peak]
y = cn[peak]
ax2.plot(x,y,'x',color='#133c9a',markersize=10,markeredgewidth=2)
ax2.text(x,y+max(cn)*0.05,"%.2f"%y,fontsize=15,color='#133c9a',horizontalalignment='center')
return ax2


