


Spectral Analysis of Deterministic Signals
This jupyter notebook is part of a collection of notebooks on various topics of Digital Signal Processing. Please direct questions and suggestions to Sascha.Spors@uni-rostock.de.
🏃🏻 Getting Started Guide
This document can be executed directly on the Bohrium Notebook. To begin, click the Connect button located at the top of the interface, then select the digital-signal-processing:Digital-Signal-Processing-Lecture Image and choose your desired machine configuration to proceed.
📖 Source
This Notebook is from a famous Signal Processing Lecture.
Short-Time Fourier Transform
The discrete Fourier transform (DFT) is not very well suited for the analysis of instationary signals when applied to the entire signal at once. Furthermore practical signals, for instance, an antenna signal, cannot be analyzed in an on-line manner by the DFT. This motivates to split a long signal into segments and compute the DFT on these segments. This transform is known as the short-time Fourier transform (STFT).
The STFT of a signal is defined as
where denotes a window function of length which is normalized by . Starting from , the signal is windowed by to a segment of length . This windowed segment is then transformed by a DFT of length .
The STFT has many applications in digital signal processing, for instance, in the spectral analysis of signals or the processing of instationary signals. The resulting spectrum depends on the frequency index and the time index . The spectral domain is therefore also termed as time-frequency domain and techniques using the STFT as time-frequency processing.
The properties of the STFT depend on
- the length of the segments,
- the overlap between the segments, and
- the window function .
The size of the segments and the window function influence the spectral and temporal resolution of the STFT. The time index of the STFT can be increased by an arbitrary step size. The step size determines the overlap between two consecutive STFTs. For instance, the spectra and have overlapping samples. The overlap is sometimes given as percentage of the segment length .
The Spectrogram
The magnitude of the STFT is known as the spectrogram of a signal. It is frequently used to analyze signals in the time-frequency domain, for instance by a spectrum analyzer.
Example - Spectrogram of a chirp/sweep signal
The following example compares the Fourier transform and spectrogram of a chirp/sweep signal. A chirp signal is a signal whose instantaneous frequency increases or decreases with time. Lets first listen to a chirp signal whose instantaneous frequency increases linear with time
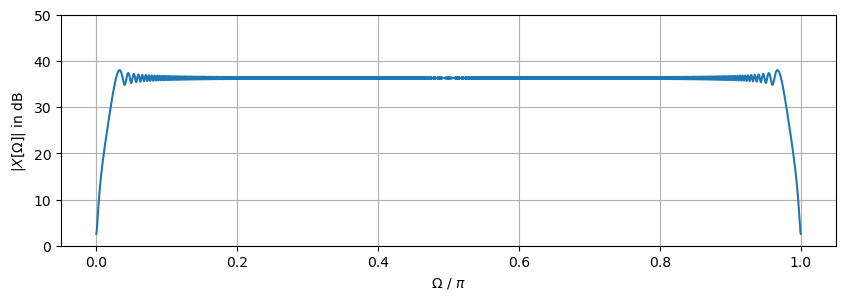
Now the magnitude spectrum of a chirp signal is computed and plotted
Followed by the spectrogram of the chirp signal

Exercise
- Which spectral properties of the chirp signal can be concluded from the magnitude spectrum and the spectrogram?
- Change the segment length
Lof the spectrogram and the overlapoverlapbetween segments. Rerun the example. What changes? - Change the window function used for the spectrogram by extending the call to
plt.specgramby the parameterwindow. For instance addwindow = np.ones(L)for the rectangular window.
Solution: The magnitude spectrum, which has been computed from the entire signal, shows only that the overall spectrum of the chirp is approximately constant. The temporal evolution of the instantaneous frequency of the chirp signal can only be observed in the spectrogram. It can be concluded that the instantaneous frequency increases linear with time. A higher segment length leads to a narrower main lobe and thus better visibility of the current frequency. With a higher overlap, the spectrum has a higher temporal resolution.
Example - Spectrogram of a speech signal
The following example computes the spectrogram of a speech signal containing a short sentence. Lets first listen to the speech signal
The signal is loaded using the soundfile module for Python.
(0.0, 2000.0)

Exercise
- A speech signal exhibits a specific spectral structure. What insights can you gain from the spectrum above?
- Change the segment length and overlap of the STFT. How does the spectrogram change?
Solution: In case of a vowel a speech signal is periodic due to the underlying speech production mechanism. A periodic signal has a line spectrum consisting of a fundamental frequency and various harmonics with multiple of the fundamental frequency. The harmonic structure of the vowels is visible in the spectrogram.
Copyright
This notebook is provided as Open Educational Resource. Feel free to use the notebook for your own purposes. The text is licensed under Creative Commons Attribution 4.0, the code of the IPython examples under the MIT license. Please attribute the work as follows: Sascha Spors, Digital Signal Processing - Lecture notes featuring computational examples.