
一、导言
许多生物学应用需要从显微镜图像中分割细胞体、膜和细胞核。深度学习在解决这一问题上取得了显著进展,但目前的方法通常专用于具有大量训练数据集的图像。我们在此介绍一种通用的基于深度学习的分割方法——Cellpose,它可以精确分割多种类型的图像中的细胞,而无需对模型进行重新训练或调整参数。Cellpose是在一个包含超过70,000个分割对象的高度多样化细胞图像新数据集上训练的。我们还展示了Cellpose的三维(3D)扩展版,它可以重用二维(2D)模型,无需3D标记数据。为了支持社区对训练数据的贡献,我们开发了用于手动标注和整理自动化结果的软件。通过定期对社区贡献的数据进行重新训练,Cellpose将持续改进。
二、Cellpose算法简介
1. Cellpose算法的安装和使用
Cellpose是实现细胞分割(cell segmentation)的一种通用算法,可以通过网址 www.cellpose.org ,或者通过 pip install cellpose 安装GUI,演示及使用视频如下。
2. Cellpose算法的通用性
生物领域许多大大小小的问题都需要用到细胞分割,作为通用模型的Cellpose可以实现对更多类型细胞的更广泛训练及测试。

3. Cellpose算法的有效性
Cellpose可以从不同类型的微观、各异的组织和不同染色或荧光标签中分离出大量不同种类的图像,甚至可以用于岩石、水母、海胆的分割。

4. 提交手动分割图像以优化Cellpose运行
在图形用户界面(GUI)中,可以以每小时 300-600 个对象的速度手动分割上传的图像,且并不需要非常精确的轮廓。上传的分割图像将会用于优化后续版本Cellpose算法的优化。
5. Cellpose分割3D图像事例
下列图像展现了 Cellpose 分割 3D 图片的案例,通过旋转图像,可以得到在投影面上的不同划分。


更多内容可以在论文https://www.nature.com/articles/s41592-020-01018-x 中找到。
三. 通过t-SNE图进行数据集的可视化
1. 导言
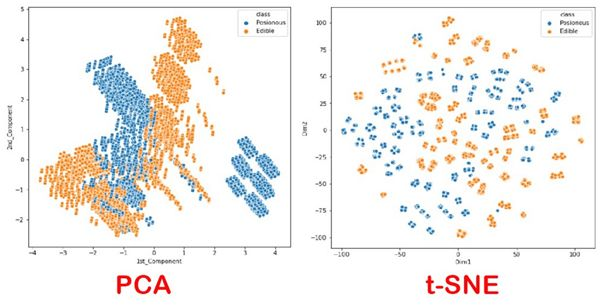
t-SNE图可以用于将数据从高维数据转到低维数据,并且保留数据的主要信息,从而可以在图像上更好呈现,便于可视化。 相较于PCA算法的降维方式,t-SNE算法可以保留数值的局部信息,更加凸显数据间的差异,而避免在将高维数据降维的过程中形成拥挤现象。t-SNE算法的流程和实现这一过程的Python程序见下。
2. t-SNE算法的实现
基本原理
t-SNE算法的基本原理是给定一组高维数据,通过点间距离得到概率分布,再在低纬平面上生成同等数量的点,计算这组点间的概率分布,并通过计算损失函数,进行梯度下降的方法更新数据,得到满足要求的低维数据。
事实上,t-SNE算法是直接在低维平面上拟合点并进行优化而实现的算法,故其优化与迭代次数,初始生成的随机数据都有关。而在实现这一操作的过程中,有如下具体的问题尚待解决:
- 如何定性高维点间的概率分布
- 如何“量化”高维与低维组间数据的差距,得到损失函数
- 如何通过损失函数更新数据,通过迭代实现优化
以下将对上述问题进行解释。
将点间距离转换为概率分布
通过如下公式,将高维坐标点与其他点的距离转化为概率分布。
其中高维数据采用指数衰减方式定义相似度:
而低维数据采用如下方式定义相似度:
用KL散度度量概率分布的差异
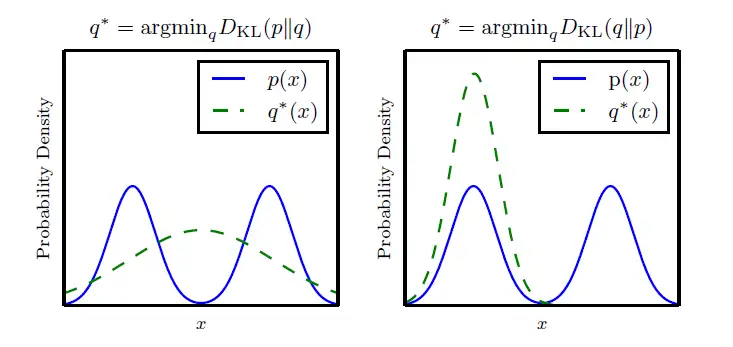
对于两个随机变量 ,定义KL散度为
且可以由琴生不等式确保KL散度非负。KL散度衡量了q对p概率密度的“差异性”,且在对上式优化的过程中,在p的高概率部分,q也会取到高概率。下图展现了与在优化过程中的结果差异:
定义损失函数,计算梯度
我们定义损失函数为 ,
对每个求偏导得到梯度:
将其组合得到梯度向量,即可通过设定学习率,实现梯度优化过程: ,过程的代码块见下。
故通过多次优化,迭代,可以通过t-SNE算法实现数据的二维可视化。剩下的代码块见下:
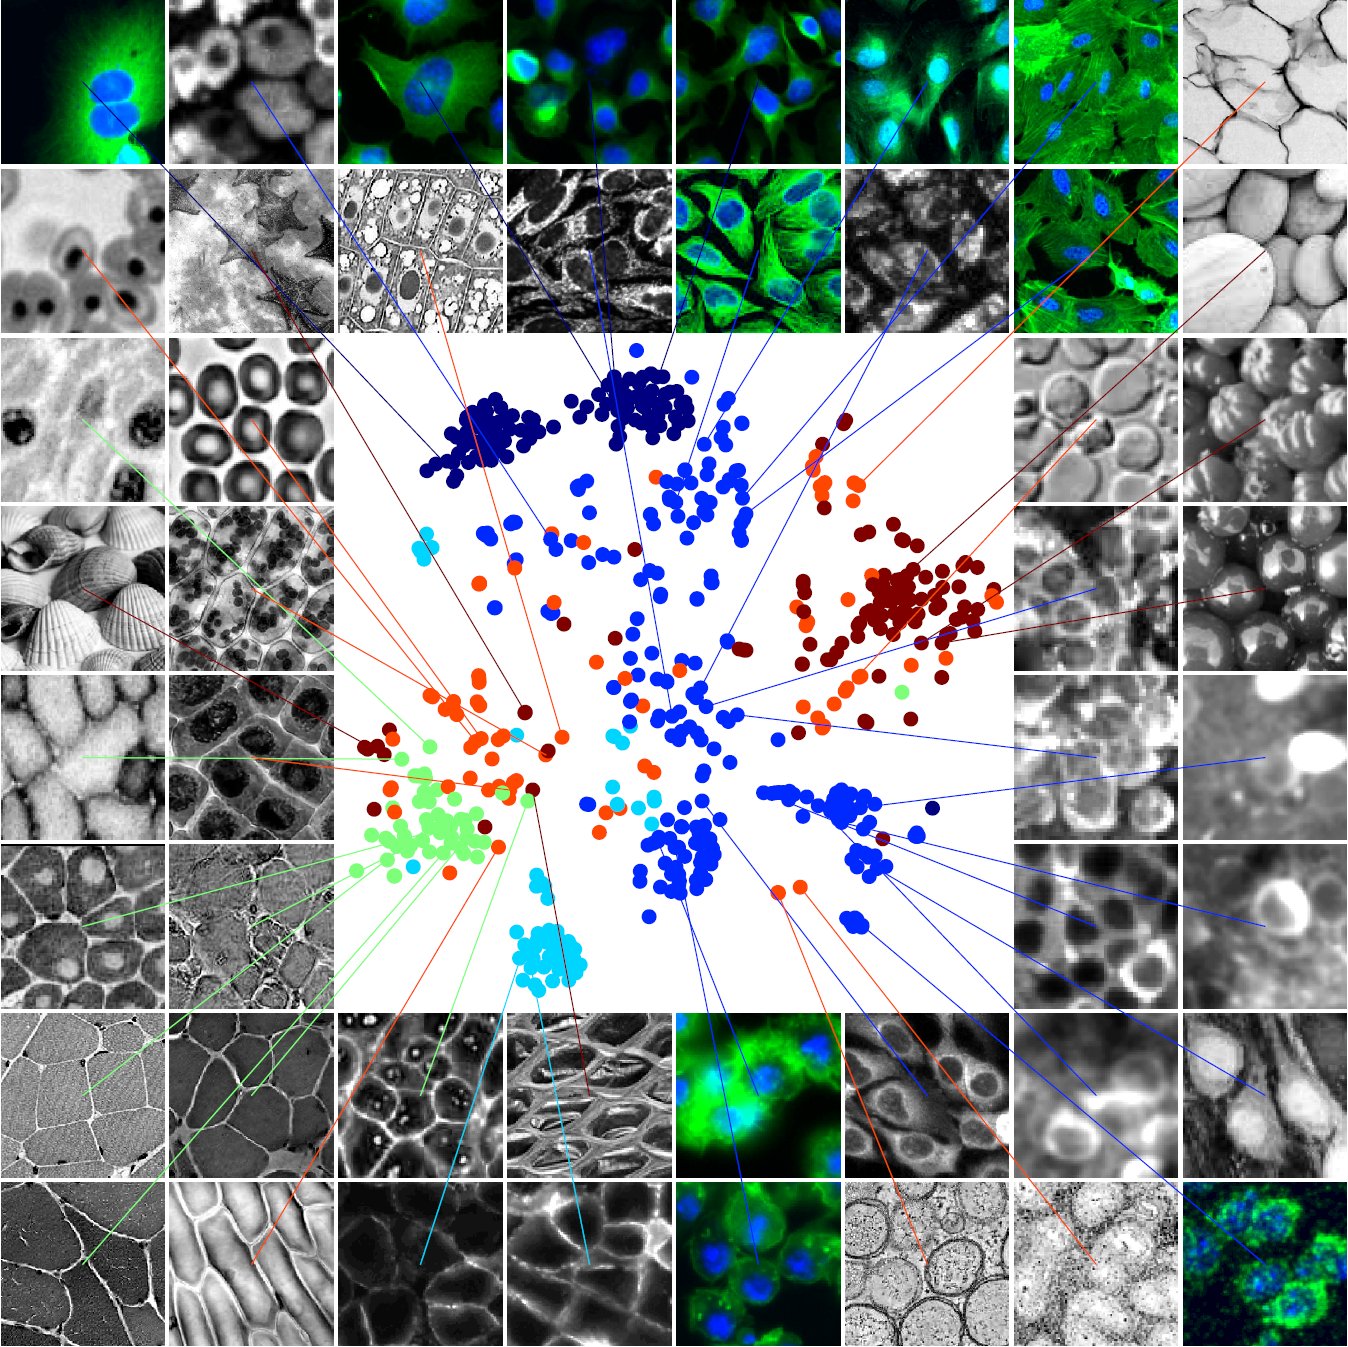
在Cellpose中,t-SNE算法对图像的可视化呈现起到了重要作用。在下图中,通过分析不同细胞的类型,可以得到对应的分类,并在二维平面上呈现。
四、Cellpose算法的代码实现
提示
通过选择“运行时”->“更改运行时类型”->“硬件加速器”并选择“GPU”,确保您已启用 GPU 访问

获取图片的 Google Drive 路径
这一步骤允许此 Colab 笔记本从 Google Drive 访问图片,但另外需要加入图片的文件夹路径。 在笔记本左侧的文件图标中。单击 gdrive 左侧的三角形图标,在下拉视图中导航到包含图片的文件夹。单击文件夹右侧的三个点,然后选择“复制路径”,并将其黏贴于Input_Directory下方。


安装 Cellpose
安装 GPU 版本的 Cellpose 并配置依赖项:
运行 Cellpose
Step 6. 根据想要分割的内容选择模型。
如果有细胞质标记,则选择细胞质以分割整个细胞;选择细胞核以分割细胞核;如果您使用的是细胞质模型并且有核通道,这也会对分割有帮助。
Step 7.在图像上测试 cellpose,且根据图像调整参数。
可以通过细胞分割的初步结果,调整参数,并寻找符合分割目的的最佳参数组合。
Flow_threshold 参数是每个掩码的流的最大允许误差。默认值为 0.4。
如果 cellpose 返回的分割过粗,不如预期,则增加此阈值
如果 cellpose 返回的分割过细,出现了错误分割,则降低此阈值。
Cell Probability Threshold 确定检测到的物体是细胞的概率。默认值为 0.0。
如果 cellpose 返回的分割数量不如您预期,或者分割太少,则降低此阈值
如果 cellpose 返回的分割过细,尤其是来自暗淡/昏暗区域的分割,则增加此阈值。
如果您不知道细胞的直径,或者细胞的直径不同,请在Diameter框中输入 0,cellpose 将自动估算直径
有关参数的更多信息:https://cellpose.readthedocs.io/_/downloads/en/latest/pdf/
使用 CELLPOSE 分割细胞
上面定义的值将用于细胞分割,且得到的结果将自动保存。
如何使用 FIJI 从掩码或标签图中提取 ROI
分割结果将保存为 16 位标签图像,其中每个单元格/ROI 都有不同的颜色或标签。如果您使用的是 ImageJ/FIJI 并希望将其转换为 ROI Manager 的 ROI,则有几种转换为 ROI 的选项:
SCF 插件(更新站点:https://sites.imagej.net/SCF-MPI-CBG/ )。安装插件后,转到 SCF-> 分割 -> LabelMap 到 ROI Manager (2D)。这应该会在 ROI Manager 中生成 ROI
另一个非常好的插件是LabelsToROIs。它有一些很好的功能可以调整 ROI 的大小并生成测量值。
将文件另存为 *.npy
如果您想保存文件以便在 Cellpose GUI 中查看它,您可以将其另存为 colab 中的 *_seg.npy 文件,您可以在 GUI 中下载并打开它。
五、使用CELLPOSE进行细胞分割-1
六、在Colab中使用GPU运行Cellpose